| Table | Columns | Filters |
The ➤ items under
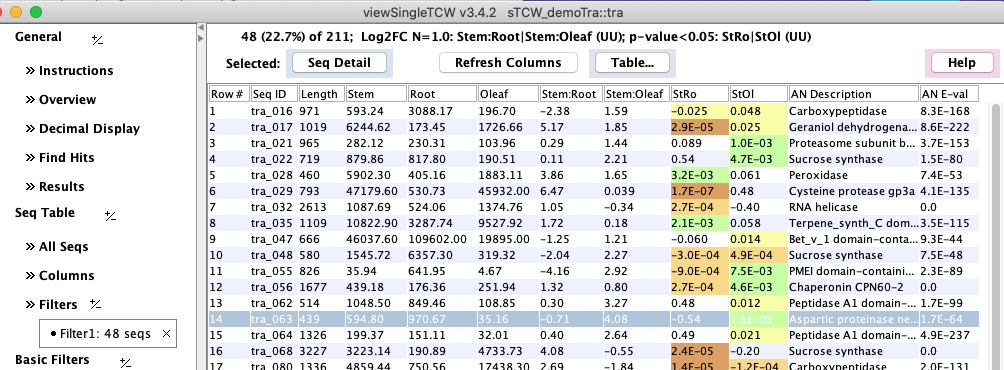
The table below was produced by filtering for all sequences that
are differentially expressed (p-value<0.05) with log2FC<=1 for stem compared to root or leaf.
The columns can be sorted and moved around. The decimal number display can be changed with Decimal Display (the above display uses color scheme #4 for the p-values). A row can be selected to view the Sequence Detail.
| The | The |

| 
|
Set Columns | Go to top |
|
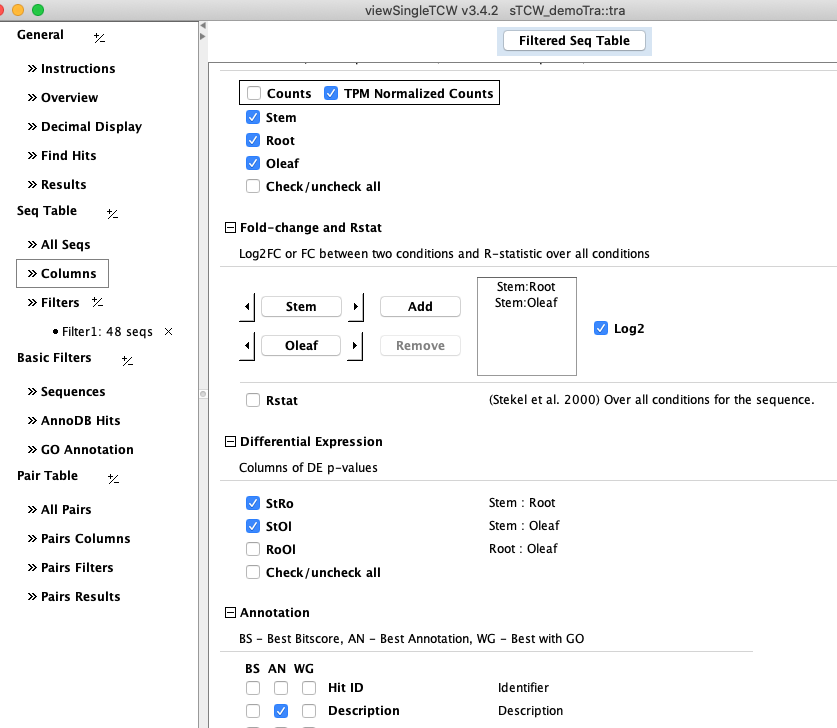
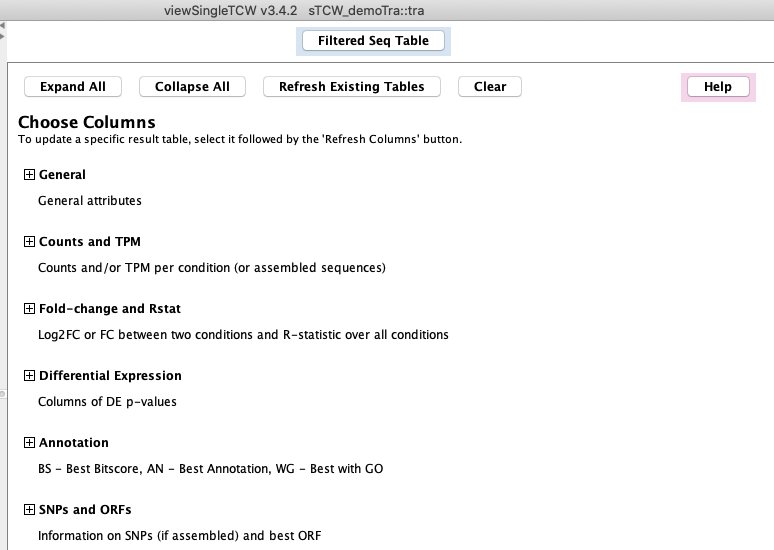
Select the Click here to see all column sections. The columns shown on the right are the ones selected for the table shown above. There are three best hits for each sequence that has annotation:
|
|
Set Filters | Go to top |
|
Select the
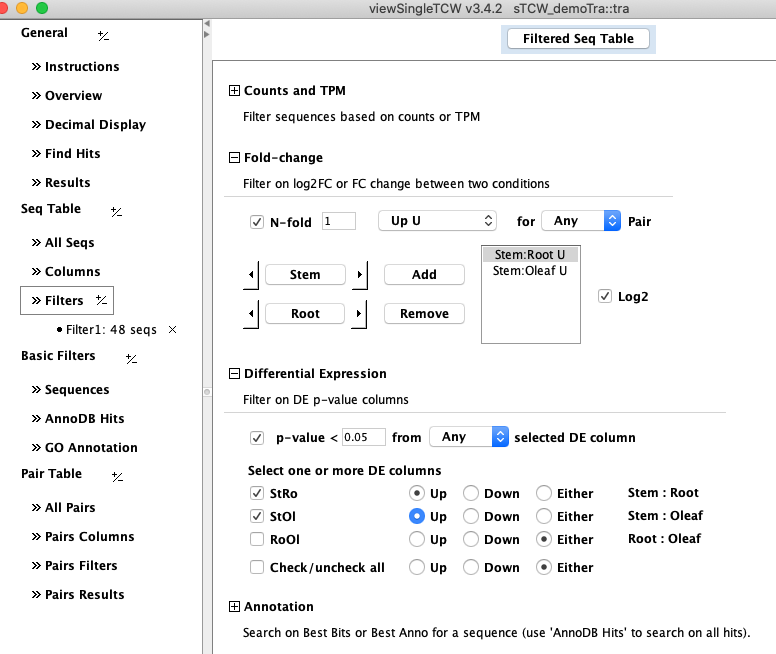
Click here to see all filter sections, which
applies one or more filters to the sequences shown in the The The |
|
| Go to top |