This guide is for the Seq-to-Seq (sequence) synteny user interface.
Note, the term pseudo and sequence are used interchangeably.
- Most of the contents also apply to the FPC-to-Seq view (unless stated
otherwise). Specific information is provided in FPC specific.
- For detailed information on installation, see
the System Guide.
- For a quick visual introduction, see the Tour.
- Please send bug reports and suggestions to symap@agcol.arizona.edu.
Contents
The Dot Plot and Circle displays are available from various places.
The SyMAP User Agreement requires you cite one of the following articles
if you use SyMAP in a paper, poster, or presentation.
        C. Soderlund,  W. Nelson, A. Shoemaker and A. Paterson (2006)
        SyMAP: A System for Discovering and Viewing Syntenic Regions of FPC maps
        Genome Research 16:1159-1168.
        C. Soderlund, M. Bomhoff, and W. Nelson (2010)
        SyMAP: A turnkey synteny system with application to plant genomes.
        Nucleic Acids Res 39(10):e68.
A. Main display
The following commands result in the Manager image similar to the one shown below:
| v5 | v4.2 | Description
| | viewSymap | symap -r -no3d | Read only, no 3D
| | viewSymap3D | symap -r | Read only, with 3D
|
|
All projects in the database will be listed on the left panel.
Selecting projects on the left panel shows them on the right panel. A check mark in the
Available Syntenies table indicates pairs that have computed synteny that can be viewed.
By selecting a cell with synteny, the Display for Selected Pair: buttons are activated.
| 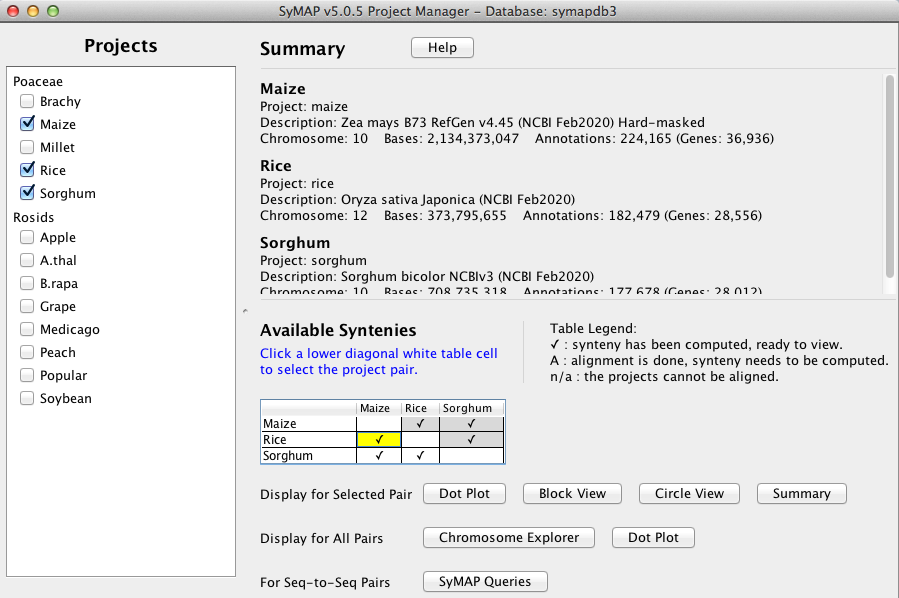
|
B. Display for Selected Pair
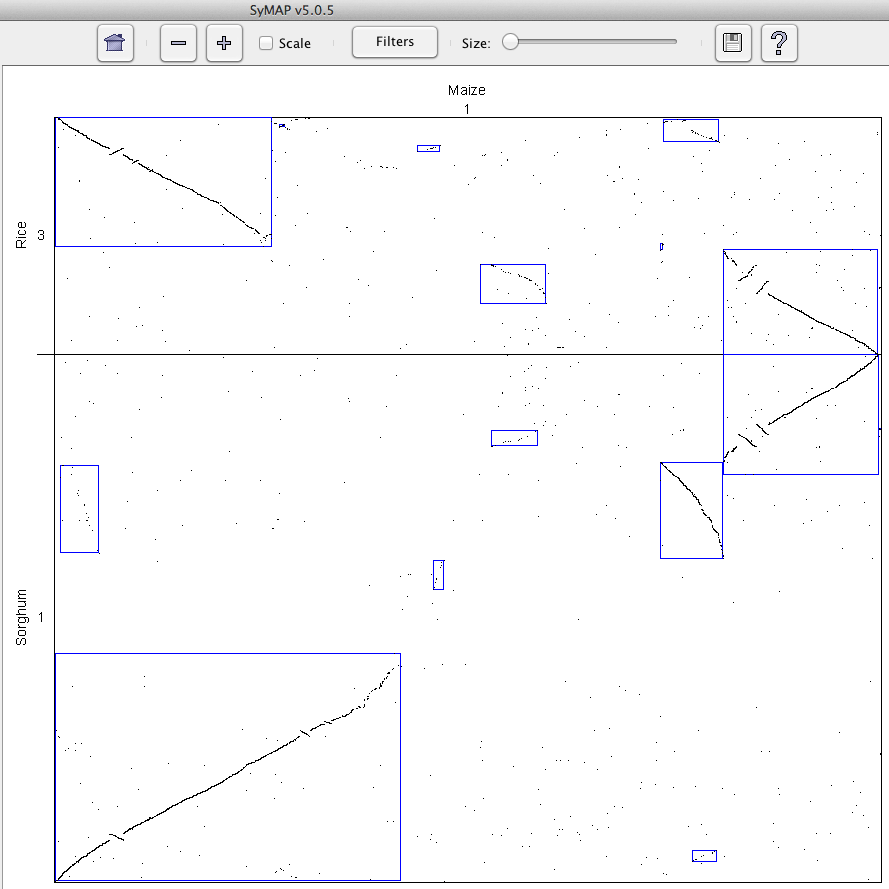
The four buttons beside this label are "whole genome" displays for the selected pair (highlighted yellow).
Dots represent anchors (also referred to as hits). A blue box indicates a
Synteny Block. The horizontal and vertical grid lines
delineate the chromosomes (or linkage groups) of the two genomes being compared.
|
The
individual grid boxes (cell) for each chromosome pair are referred to as Regions, and clicking
on a region brings up a larger-scale Region view.
Within the region view:
- Click on a blue box or drag the mouse to highlight a sub-region.
- Then, click on the highlighted sub-region to bring up a SyMAP 2D view for that sub-region.
- This is illustrated in the chromosome Dotplot.
| 
|

Home Resets the zoom selection to the full grid view of the entire dot plot.
Zoom The plus (+) and minus (-) buttons shrink or grow the display.
Scale The check box resizes the species displayed on the y-axis according to the current scale of
the species displayed on the x-axis.
Reference The drop-down menu allows the reference species on the x-axis to be changed.
Size The slider increases/decreases the size of the dots in the display.
|
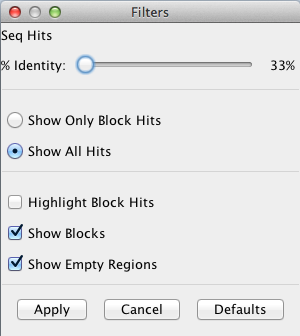
The Filter image on the right indicates the default settings.
Show Only Block Hits
A block hit is a hit that the SyMAP synteny-finding algorithm
used to create a synteny block.
Show All Hits
Displays all hits. Note that the SyMAP hit loading algorithm removes
some repetitive hits from the raw anchor set, so some hits from the raw BLAT
or MUMmer files will not be shown.
Highlight Block Hits
Highlight hits that make up a synteny block in blue.
Show Blocks
This option draws blue rectangles around the synteny blocks.
Show Empty Regions
When deselected, hides regions that do not contain any synteny blocks.
| 
|
The image below shows the block display for Maize and Rice.
The 10 Maize chromosomes are color coded as shown at the top, and aligned to
the 12 rice chromosomes. The Rice to Maize block view can be viewed by
selecting reverse.
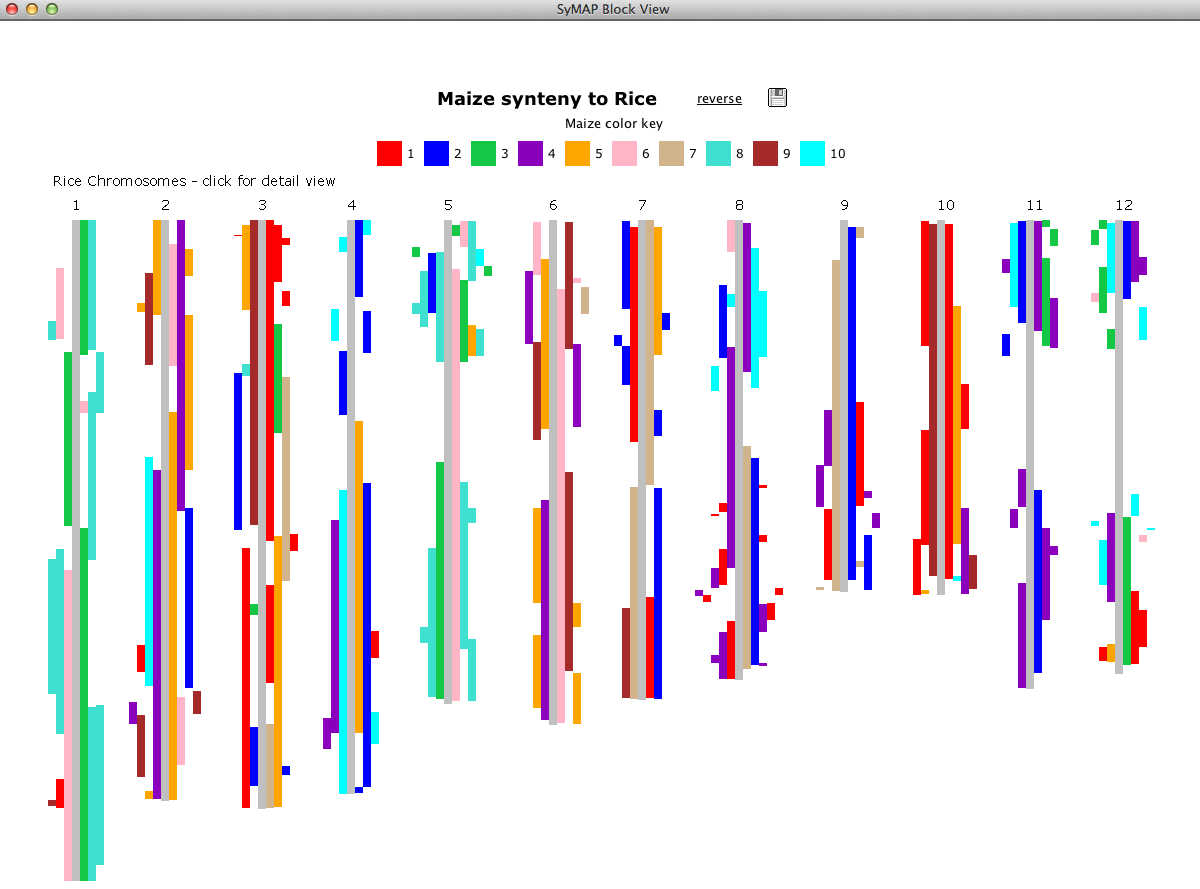
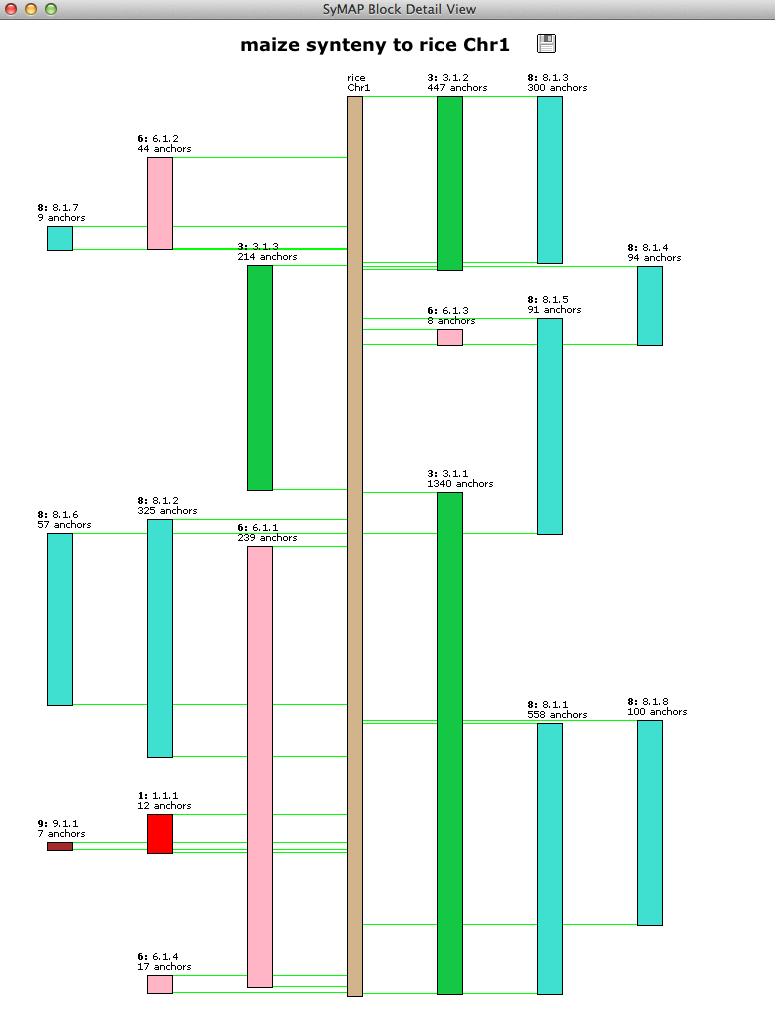
| Clicking a chromosome pops up a window of the chromosome as shown below. Clicking
a block pops up a 2D view.
|
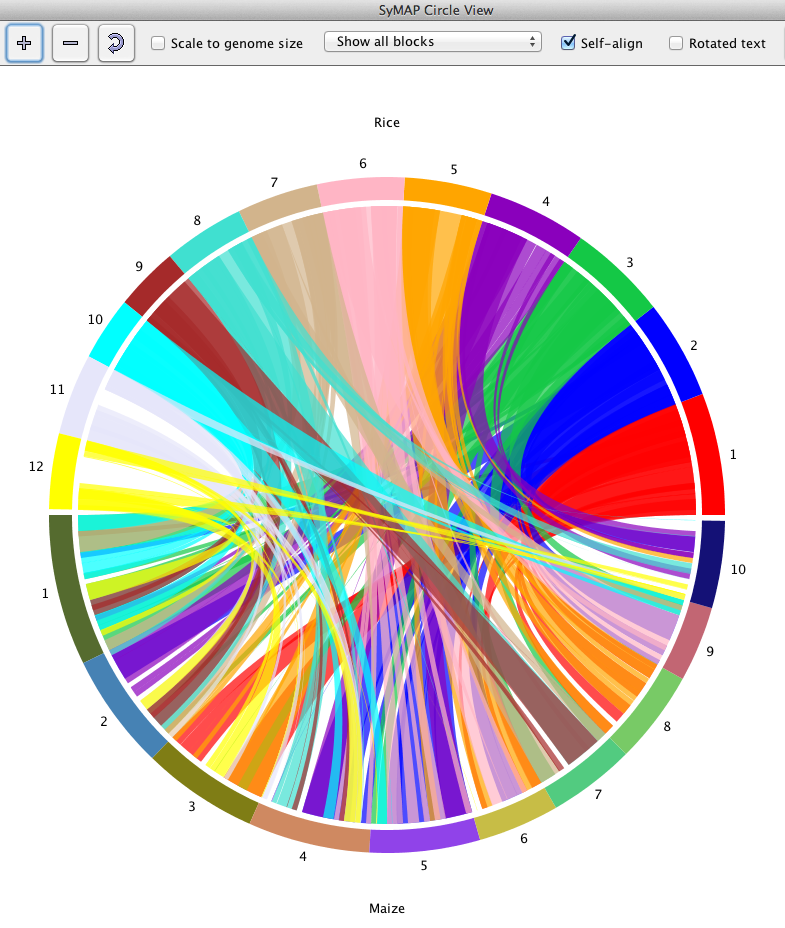
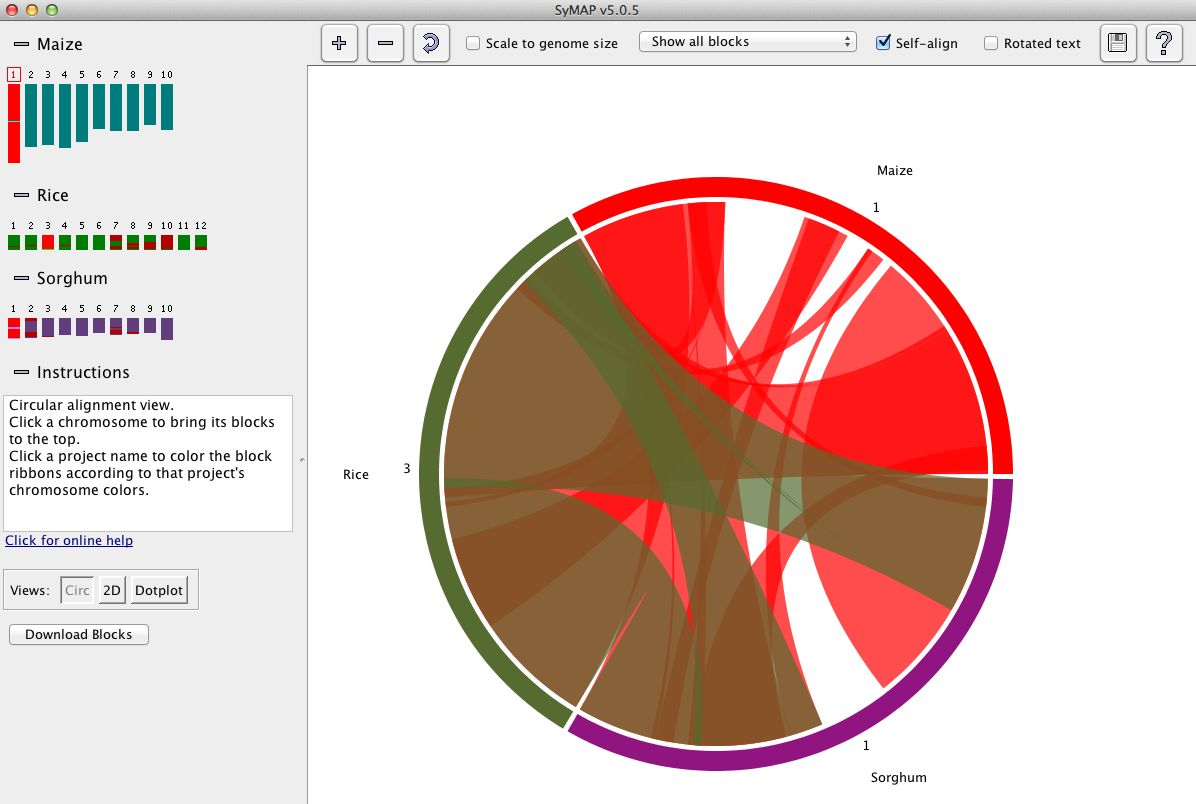
The circle display shows the chromosomes arranged in a circle,
with synteny blocks shown as colored
ribbons between the chromosomes.
The color of a ribbon comes from one of the two chromosomes it connects; for example,
in the image below, the Rice Chr1 is red and the corresponding ribbon is red.
Clicking on a species names causes its colors to be used preferentially (sometimes it
is necessary to click at the very beginning or end of the name for this to work).
Clicking on a chromosome (e.g. the the red part of the circle for Rice Chr 1)
causes ribbons from that chromosome to be shown on top.
|
The three controls on the left above the circle image control various aspects of the display.
The first two buttons (+, -) change the size, while the third rotates the image.
Scale to genome size: This checkbox causes the chromosomes to be drawn proportionately to their
actual length in basepairs. Otherwise, each species is allocated the same amount of space,
e.g. for two species each one gets exactly half the circle.
Show all blocks:
The drop-down menu has "Show inverted blocks", "Show non-inverted blocks",
and "Two-color scheme", where this last option shows inverted=green, non-inverted=red.
Self-align: This checkbox controls whether blocks are shown between chromosomes
of the same species (if there is a check mark in the projects self-synteny cell indicating
its been computed).
Rotated text: Depending on the system, it may be easier (or harder) to read with
the text rotated.
|
|
Note, if you are running SyMAP over an X-windows session on a remote server,
the circle display will draw very slowly. For this case, the 3D display (if available) is
recommended (or, use VNC or screen sharing to the remote server).
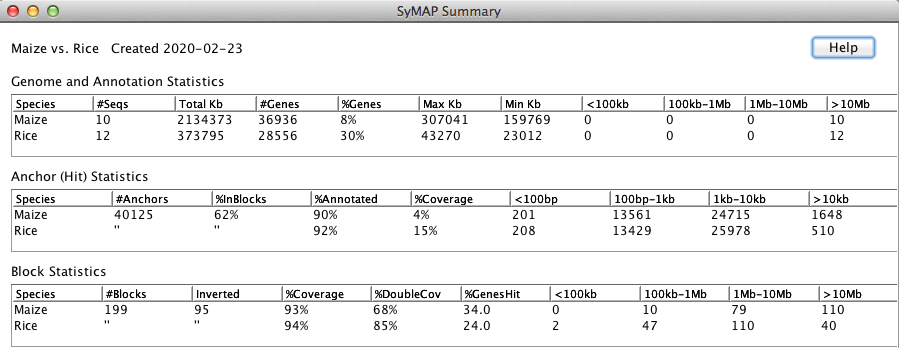
The Help button on this view explains the different columns.
C. Display for All Projects
Select two or more projects and the "Chromosome Explorer" and "Dotplot" buttons
will be activated.
The Explorer is a two-panel display in which the left panel is used to select specific chromosomes, while the right panel
shows the synteny for the selected chromosomes. Four different right-panel views are available:
circle,
2D,
Dotplot,
and 3D (the 3D is not available through the web and only on systems that have the Java 3D libraries).
Below is a snapshot of the Explorer showing the circle format, which is the initial view.
Left panel: The left panel controls which species and chromosomes are shown:
- Click a chromosome rectangle to add it to the display in the right panel. Click it again to remove
it.
- Click the chromosome number above a chromosome to make it the reference. (The
choice of reference sequence does not matter for the circle view,
but it is important for the 2D, 3D, and Dot Plot views; see below).
- Adding and removing chromosomes affects the 3D and Circle views instantly.
To add/remove from the 2D or Dot Plot
views, open either 3D or Circle view, make the change, and then re-open the 2D or Dot Plot.
Instructions: As the mouse moves over various
components, instructions for that component are shown in the Instruction box.
The four buttons in the lower-left corner of the window change the view in the right panel,
where the choices are
3D,
2D,
Dotplot,
and Circle.
Download Blocks: Exports a table of all of the synteny block co-ordinates for the selected species; see also Data Download.
Click the minus (-) button next to a project name or the Instruction box,
and that section will be hidden;
the minus sign will change to a plus.
Click the plus (+) button to show the project or Instruction box..
Right panel: The right panel shows the synteny display for the species and chromosomes selected on the left.
There are four views: 3D (if available),
2D,
Dotplot,
and Circle.
The first three modes are
essentially overview modes, while the 2D view allows zooming in to details, all the way
to the basepair level if desired.
Each right-panel display format has its own controls; see the individual sections for details.
This view is shown in the above image.
All features are described in the first circle section,
except it is chromosome-based instead of genome-based.
All features are described in the first dot plot section,
except that it is chromosome-based instead of genome-based.
Selecting a region followed by a synteny block (or selected region)
brings up the 2D view.
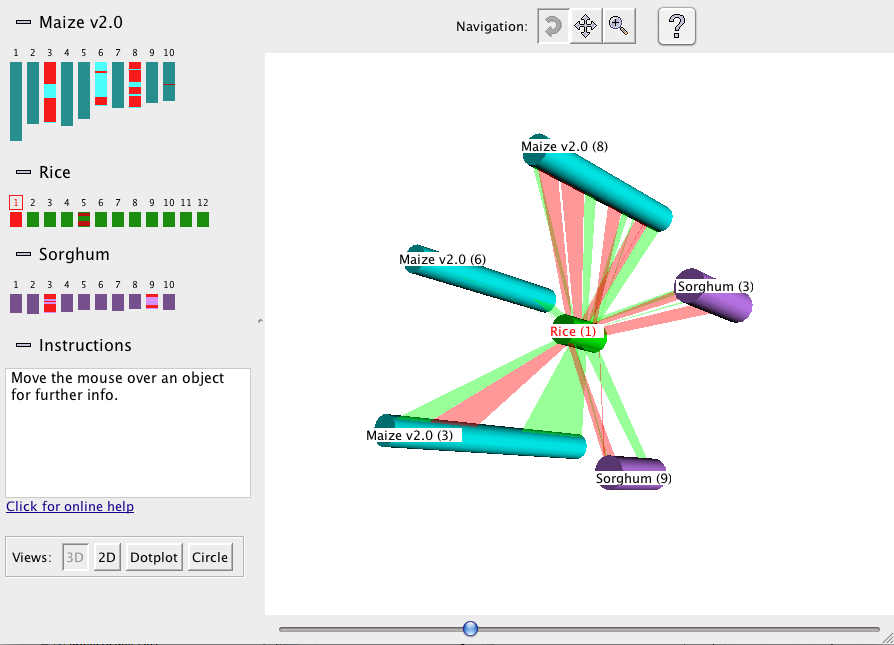
The 3D is not available through the web and only on systems that have the Java 3D libraries.
The 3D display shows the selected chromosomes arrayed at equal spacing around the reference, which is
placed in the center (see figure below):
|
The synteny blocks are shown as colored ribbons, with direct synteny blocks colored red, and inverted
blocks colored green. (Note that the direct and inverse designations are for the overall block, but blocks may
contain smaller-scale regions which are inverted relative to the block as a whole.)
Drag the mouse over
the 3D view to rotate, move, or zoom the view, depending on which of the three Navigation buttons at the top is
selected. For example, if the leftmost button is selected, as shown in the figure, then dragging with the
mouse causes the figure to rotate.
|
|
The 2D display is activated from the Explorer by
clicking the 2D button (or by selecting a region or block from a dot plot).
|
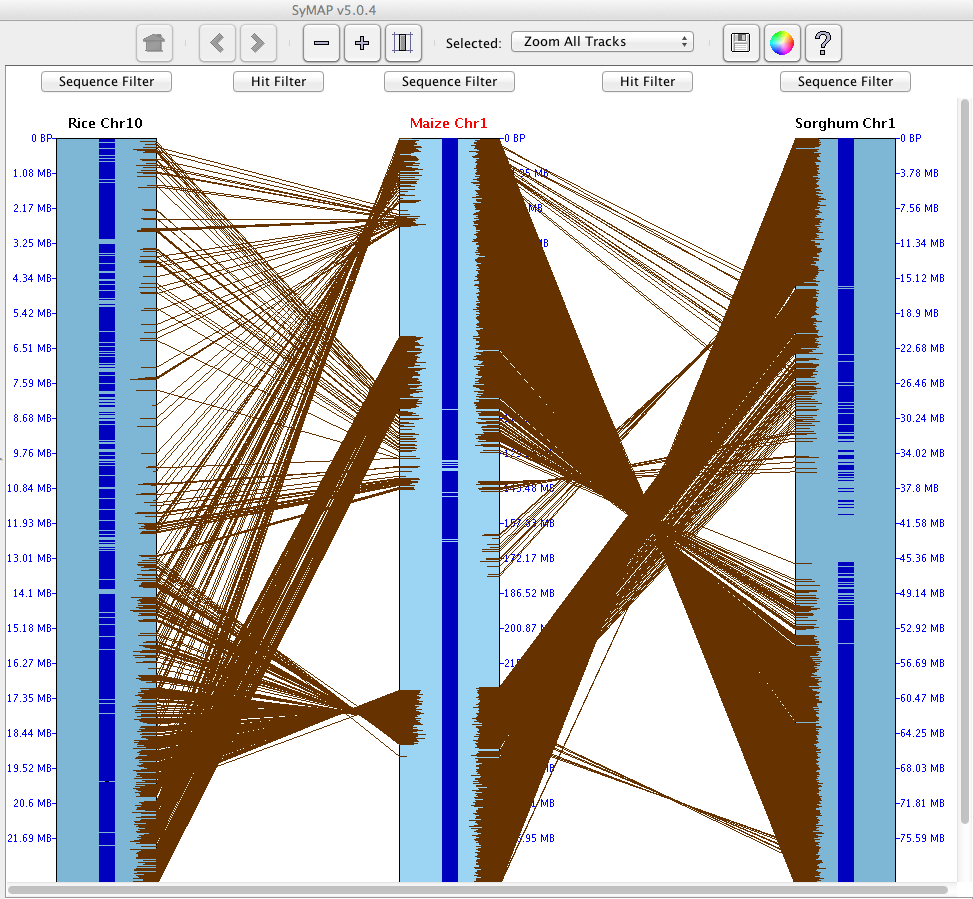
On the right is an image depicting an alignment from Rice Chr10 to Maize Chr1 to Sorghum Chr1.
Note that Maize Chr1 is the reference
chromosome, hence is placed in between the others.
The alignment window displays tracks (drawn as rectangles) of sequence information,
showing synteny hits (drawn as lines) between tracks.
Left click in a track shows the most commonly used filters and features (e.g.
flipping the region). They are also on the filter menu above each track
(e.g. Sequence Filter). See the Filter descriptions below.
|
|
The control panel provides buttons that allow for navigation between views, scaling, color customization, and help.

History (Home, <, >) SyMAP retains a record of the prior views (like a web browser).
The history navigation back (<) and
forward (>) buttons allow you to
move back and forth through the previous views.
The Home button returns to the initial view.
Zoom Buttons (-, +)
The zoom buttons allow for quickly expanding and narrowing the view region.
The minus (-) button shrinks the view region by 50%, keeping
the same center, while the plus (+) button doubles the view region,
again keeping the same center.
Scale Button
The Scale button
(right of +) resizes the tracks so that they are in the same scale
(base pairs per pixel) as the reference sequence track in the view.
Selected region
This drop-down selector assigns a function to the mouse's left button
click and drag actions:
| Zoom All Tracks | Zoom the track to the selected region and all other tracks with hits in the region.
| | Zoom Selected Track | Zoom to the selected region on the selected track; all other tracks do not change.
| | Align (Max 30000) | Open the base alignment view for the selected region (see Base View).
No more than 30000 bases can be selected.
| | Show Sequence | The selected sequence will be shown in a popup. This has limited utility, but is the
only way to the underlying sequence of a region than may or may not have hit.
|
Colors Opens a menu for customizing colors.
Additional navigation:
| Resize Track |
Drag bottom of track |
Position mouse at bottom of track (resize cursor appears), hold down left
mouse button, and move mouse. |
| Scroll Track |
Mouse wheel |
Position mouse over track and use mouse wheel. |
| Filter |
Right mouse button |
Position mouse over track or white space between tracks, and click right mouse button. |
The main panel is divided into tracks,
where each track represents a sequence or FPC map (see
FPC specific for details of the FPC tracks). Each track
is aligned to the track oh its immediate left or right, and the
individual pieces of evidence for synteny (referred to as anchors or hits) are drawn as
lines between the two tracks. Above each track
is a "filter" button which allows configuration of the content displayed for
that track (e.g. annotations), and above the space between each pair of tracks
is a "hit filter" button that allows selection of the types of hits displayed
between the tracks on either side (e.g. only show syntenic hits).
Sequence Track and Filter
A Sequence track may represent a sequenced chromosome, linkage group or scaffold.
The sequence length
and the coordinates of the displayed region are indicated above and below the track.
Annotation data of the following types may be loaded into SyMAP and displayed.
(Note that display colors can be changed.)
| Annotation Type |
Display |
| Gaps |
Red band across the chromosome |
| Centromere |
Blue "X" across the chromosome |
| Predicted genes and exons |
Annotation strip in center of chromosome (see image ) |
The sequence information displayed can be configured via the
Sequence Filter by clicking the
Sequence Filter button above the sequence track, or by right-clicking the
mouse over the sequence track.
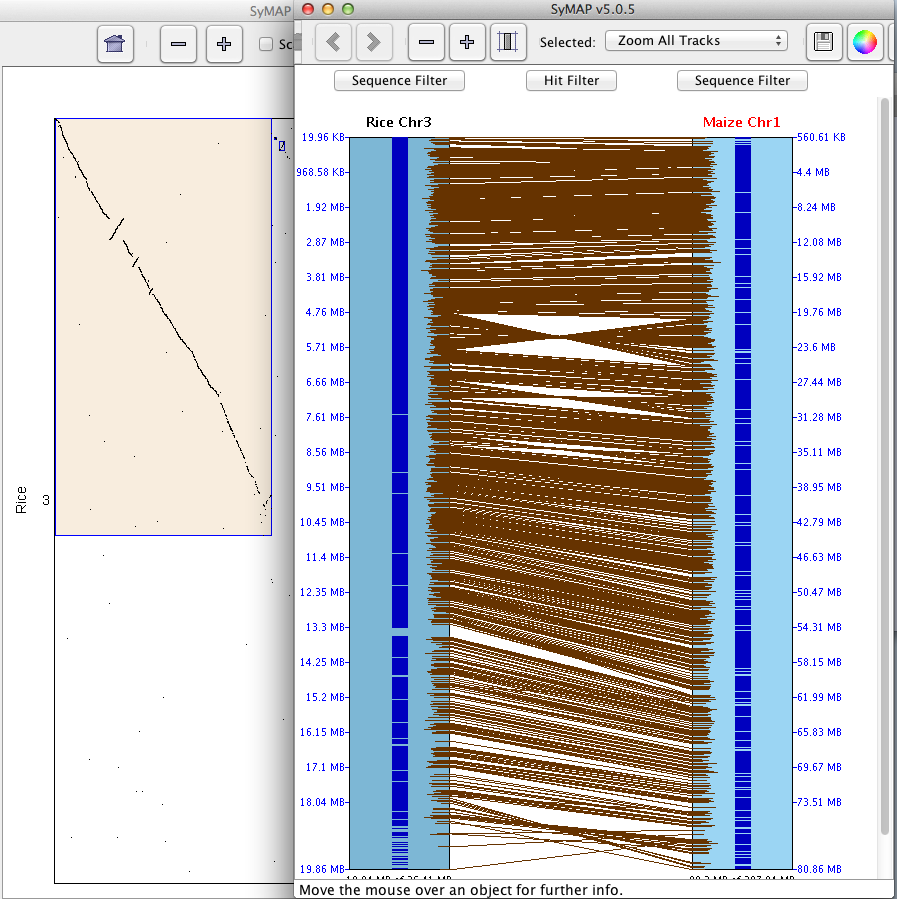
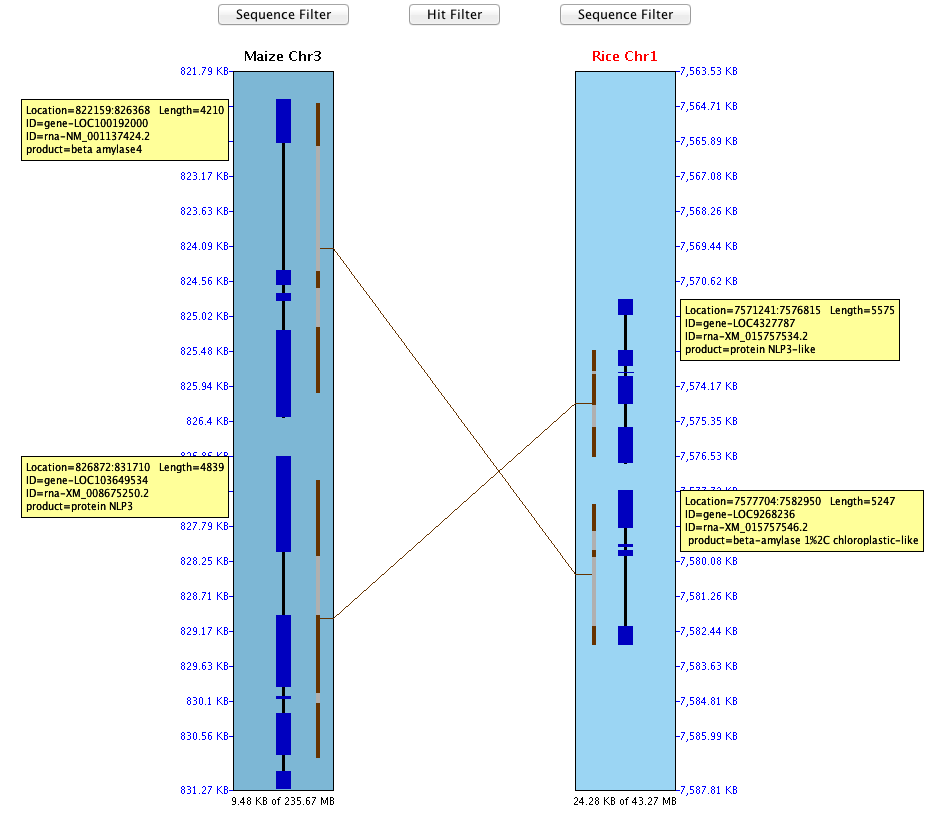
The example below shows a sequence-to-sequence alignment, which was derived by right-clicking
at the top of the region, pulling down the mouse and releasing in order to view a small region.
|
The black lines with heavier blue bars interspersed down the center indicate exon/intron
predictions. A solid black line would indicate the absence of introns in the annotation.
The alternating brown/gray lines indicate anchor clusters. The solid brown lines indicate
a single anchor (or multiple anchors very close together), while the gray lines are spaces with no alignment.
The ruler on the right side of the sequence rectangle
shows the relative BP position along the sequence.
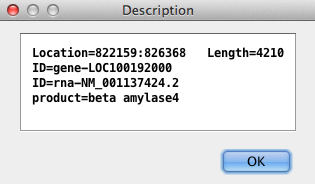
Additional information about each
annotation may be seen by choosing "Show Annotation Description" from the Sequence Filter.
|
| | Right clicking everywhere but in a yellow annotation box provides
a pop-up menu with most of the items found on the Sequence Filter. Right
clicking on a yellow box results in a popup, as shown on the right; this
is useful for copying all or part of the description, and when the box
is partially hidden.
|
|
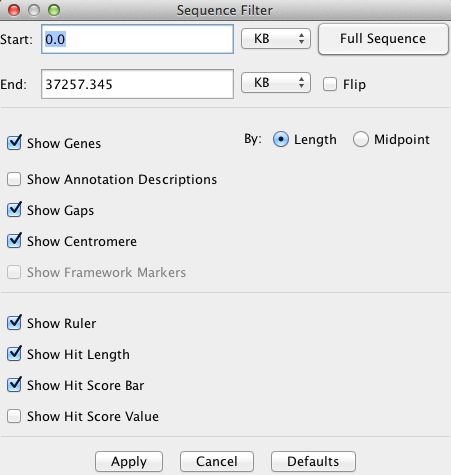
The Sequence Filter allows the user to select the type of information shown for the
sequence. It is accessed via the Sequence Filter button above the sequence track,
or by right-clicking the mouse over the sequence track.
Start and End
The positions of the sequence display can be set via the
corresponding text boxes.
The units of the values entered can be selected from the accompanying drop down menus
(BP, KB, MB, GB).
Full Sequence Sets the start and end positions of
the sequence display to encompass the whole chromosome.
|
Flip Reverses the orientation of the sequence track.
Show Genes
Enables/disables the display of gene/exon annotations
along the sequence.
Show Annotation Descriptions Enables/disables the display of the annotation descriptions along the
right side of sequence. NOTE: this only works if you are zoomed in close enough that they can clearly
be displayed.
Show Gaps Enables/disables the display of sequence gaps (drawn as solid red
rectangles) along the sequence.
Show Centromere Enables/disables the display of the centromere (drawn as a cyan "X") on
the sequence.
Show Framework Markers Typically genetic markers or radiation hybrid markers.
This option enables/disables the display of framework markers (drawn as solid green
rectangles) along the sequence.
|
|
Show Ruler Enables/disables the display of the sequence ruler along the right side
of the sequence.
Show Hit Length Enables/disables the display of the hit length line next to each hit along the
sequence. The hit length line denotes the start and end points of the hits relative
to the sequence (may not be visible for tiny hits).
Show Hit Score Line Enables/disables the display of the score line next to each hit along the
sequence. The length of the line represents the magnitude of the % Identity value for
the hit.
Show Hit Score Value Enables/disables the display of the score value next to each hit along the
sequence. The score value corresponds to the % Identity value for the hit.
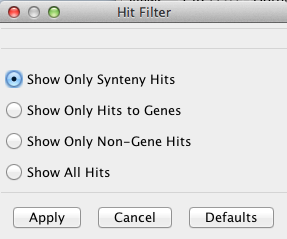
The Hit Filter menu allows the user to select which types of hits are displayed.
|
The types of filter are as follows:
Show Only Synteny Hits Shows only hits that are part of a synteny block.
Show Only Hits to Genes Show only hits which intersect a gene annotation.
Show Only Non-Gene Hits Show only hits which do not intersect a gene annotation.
Show All Hits hows all known hits.
|
|
Select "Base View" from the "Mouse" drop-down, then select a region of maximum 50kb.
To select a region, drag the
mouse along the sequence and release when the desired range is highlighted.
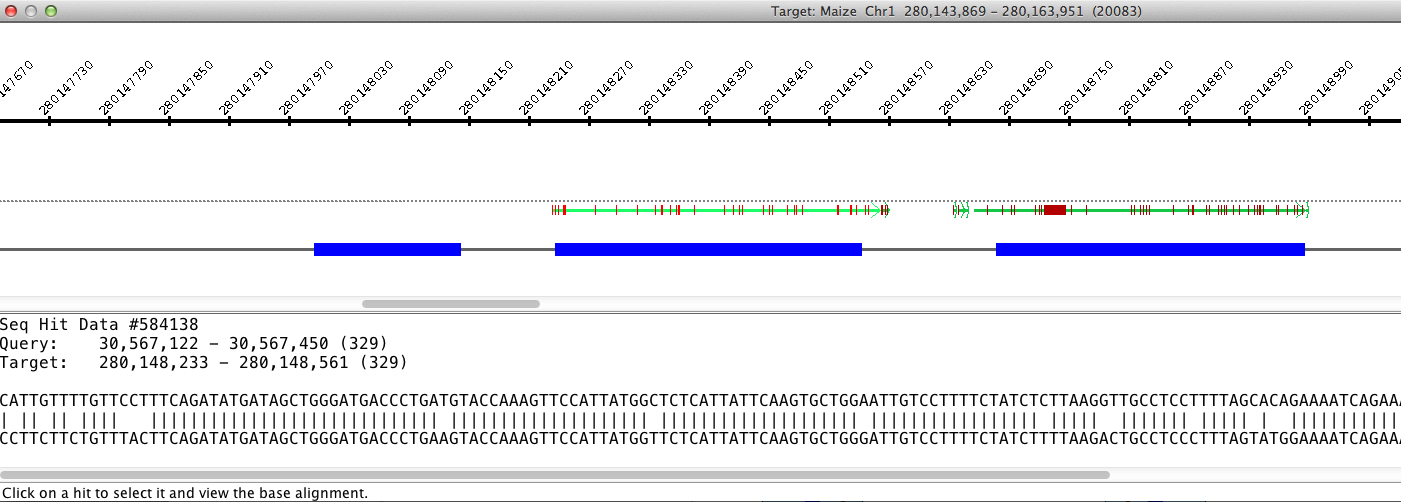
If there are multiple hits in the selected region, than the base view of those hits
appears in a new dialog. This view consists of a ruler along the top showing the area
of the sequence covered, the hits, and the genes.
Hits
Hits are displayed as lines with an arrow on one end showing the direction of the hit.
Clicking on a hit brings up the hit's
BLAST view in the bottom of the dialog. The hit presently shown in the BLAST view is
shown in gray. A vertical red line along a hit represents a mismatch .
A vertical green line
along a hit represents a deletion. An arrow pointing down (i.e. 'v') along a hit
represents an insertion.
Genes
Annotated genes are displayed below the hits. Exons are represented by a blue box, and
the leftmost or rightmost exon box will have an arrow tip indicating whether the gene
is on the + strand (right-pointing) or - strand (left-pointing) relative to the
sequence. The system attempts to expand the view to show the full gene that has
hits. Genes that overlap this gene will be partially shown.
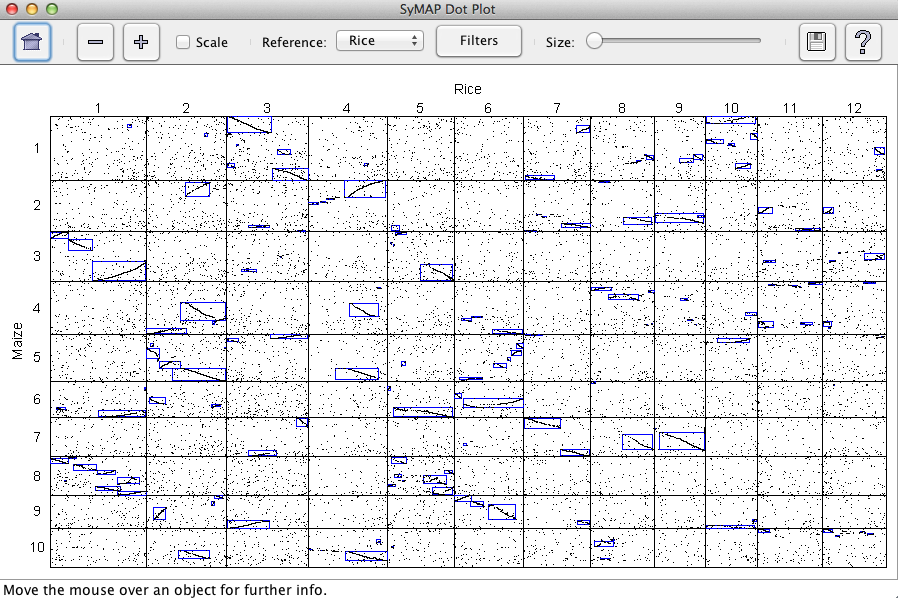
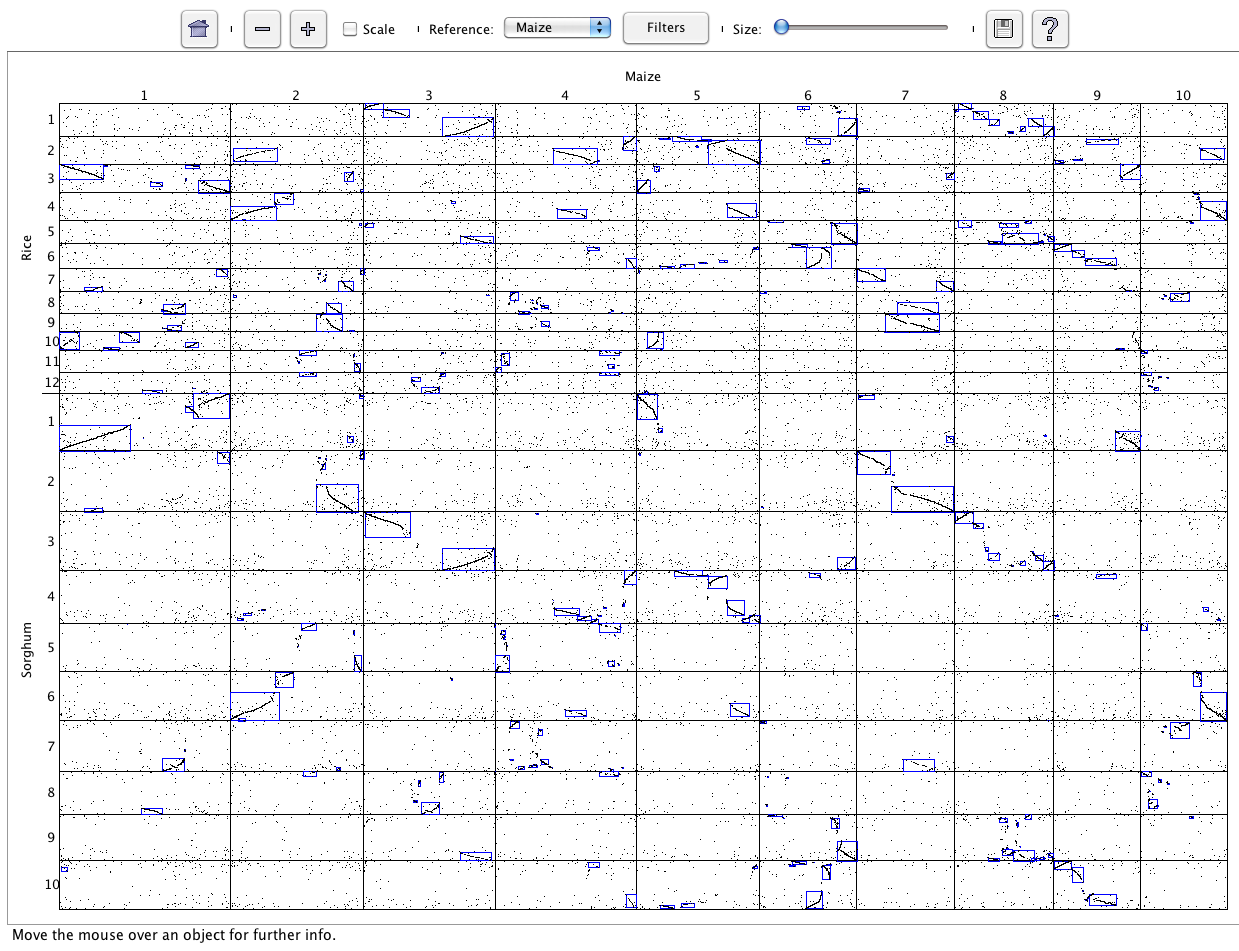
All selected projects will be shown in the Dot Plot. The interface is the same as
discussed in Dot Plot (Two Genome). The dot plot in the image
shows three genomes.
The query interface only works for multi-genome Seq-to-Seq synteny
(i.e does not work for self-synteny or FPC-to-Seq).
This interface has two basic
functions:
A. Locate homologous (or paralogous) regions based on annotation and location
B. Create putative gene families spanning multiple species, and apply family-based filters
Some sample queries which are possible through the interface:
• Find un-annotated regions on one genome which are homologous to regions on another genome
which have already been annotated.
• Find putative gene families which are present in one lineage but absent in another.
• Identify the likely orthologs on genome A of a given gene on genome B, by using synteny blocks
or exactly collinear pairs to filter out probable paralogs.
• Find orphan genes which are specific to one genome.
To open the query interface, first select two or more sequence projects in the Project Manager (note, the
queries are not supported for FPC maps). Then press the "SyMAP Queries" button to open the interface:
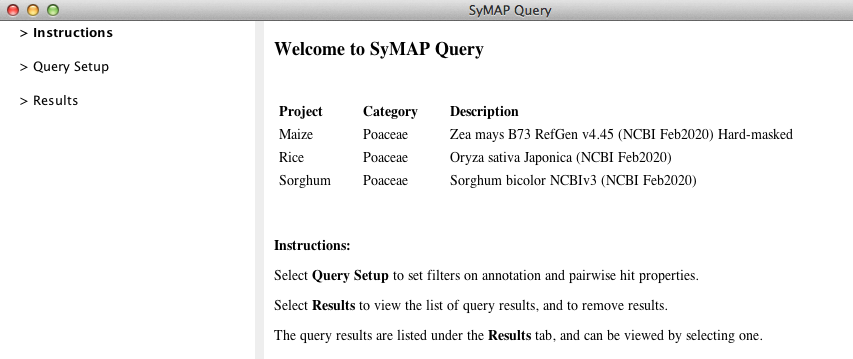
The Overview window (above) lists the projects which were selected for querying. To set up a query, open the
"Query Setup" window by clicking on its title in the left panel. This opens the window below:
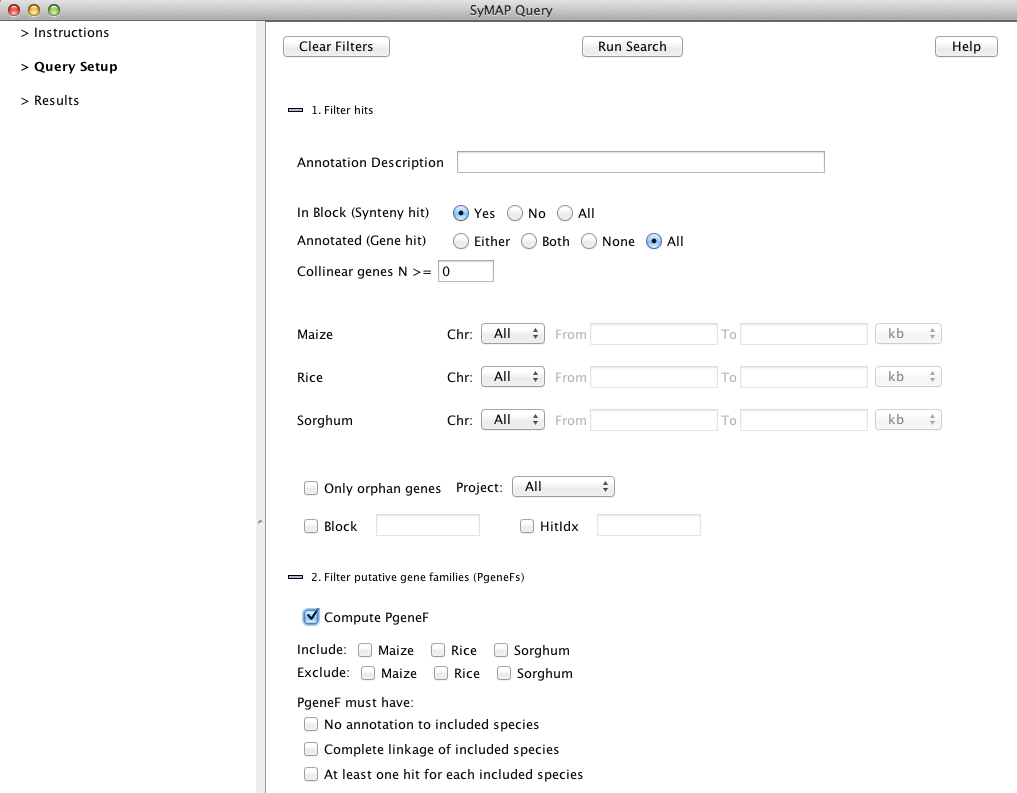
Here you set up the query and then press "Run Search" to execute it.
The query occurs in two stages, corresponding to the section numbers
on the Query Page. The second start, PgeneF, only runs if the "Compute PgeneF" is checked.
1. Filter hits
The first stage is to retrieve hits (anchors) from the database, based on
filters such as chromosome and annotation string. Note that each anchor
connects two species and hence represents a pair of putatively-related
regions on the two species. The filters are described in the Help in the upper corner.
Annotation Description
Enter a search string for any annotation keyword
(e.g. the gene name or description). Hits will be returned which overlap a matching annotation
on either side.
When looking for a particular gene, say "gene-LOC9268236", enter this into the text box
and "Run Query". If there are no results, select "Only orphan genes" and run it again.
Collinear genes N>= N
Return only hits which are part of a pair of N aligning genes having no intervening
non-aligning genes. There is a column called "RunSize" that provides the number
of adjacent aligning genes. Note that this is not the same as synteny blocks, which
allows intervening non-aligning genes.
Show orphan genes
If checked, this shows all orphan genes for the project selected (or all projects).
That is, it shows genes that have no overlapping hits to ANY other project for which
it has been compared.
2. Filter putative gene families (PgeneFs)
Using the hits that pass the Stage 1 filters, SyMAP constructs putative gene families (PgeneFs)
spanning the selected species. This is done by grouping hits whose hit regions overlap on
at least one genome. Note, if you have more than 6 species selected, this stage can take
an hour or more.
Each PgeneF is given a number, which is shown in the Query Results table (column name "PgeneF").
The size of the PgeneF is also shown (column "PgFSize").
The filters are described in the Query Help page.
SyMAP Query Result Table
When the query is complete, the Query Results page opens showing the table of results:
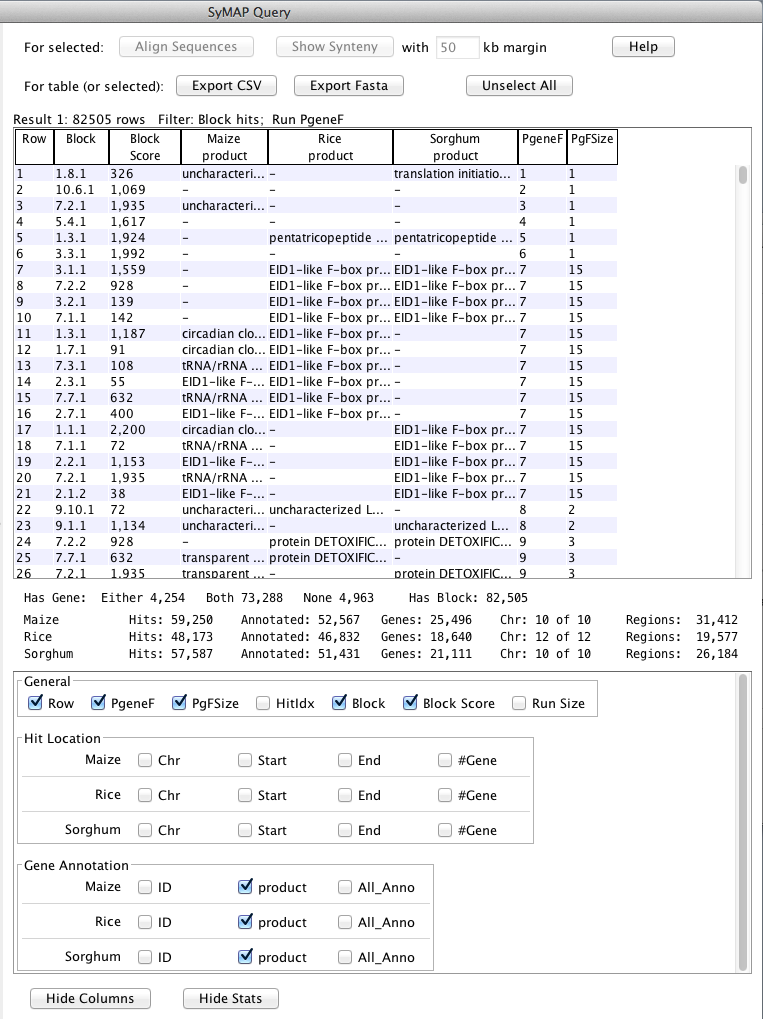
The table contains all the hits (anchors) resulting from the query. Each hit connects
two species and you can see the respective chromosomes and start/end locations of
the hits, as well as gene annotations overlapped by the hits.
Note that the table contains columns for all of the selected
species (see snapshot below), but each hit only connects two species, and the other species columns are empty.
If the query specified orphan genes, then each row represents one gene and shows data only
for one species.
The columns can be sorted by clicking on the column name,
and rearrange them by dragging the header boxes.
Button functions
Align sequences:
Sequences of the selected hit are written out and a multiple alignment is created
using MUSCLE (Edgar 2004 NAR:32).
Show Synteny :
Brings up a SyMAP 2-track view for each selected entry, so the hit
can be seen in their full chromosomal context. The hit is initially padded to each side
by the margin amount indicated (default 50kb), but you can easily zoom further out in the 2-track views.
Export CSV:
Saves the selected hits (or entire table) using the selected set of columns to a CSV format suitable for import into Excel.
Save as Fasta: Sequences from the selected hits (or entire table) are written to a Fasta file. Both sides of each hit
are written, using the start/end coordinates shown in the table.
Results Table Columns
You can add/remove columns using the "Select Columns" button at the bottom. This
opens up a column-selection section. The columns are explain the the Help button on the table.
Self-synteny can be viewed in all views (see Dot Plot).
The "SyMAP queries" does not work for self-synteny.
There are two ways to download data for SyMAP synteny blocks, individual anchors, and annotations:
- Through the Explorer. Select the species of interest,
open the Explorer, and the download button is at the lower left.
This exports a table of all the computed synteny block co-ordinates for all the
selected species, including their self-alignments, if those were computed.
- Through the Query interface. For example,
choosing two species and executing a query with the default parameters
will show a table of all the anchors found between the two species, plus
their annotations and synteny block membership, if any.
Most displays shown have a  set of icons. set of icons.
The left icon is for printing the image. However, this does not work with all versions
of Java. If it does not work, use the system "Screen Capture" (all the images in this
document were created with screen capture, along with the images in the SyMAP publications).
The right
icon brings up the this web page, typically to the correct section (obviously, there needs
to be an internet connection).
|